 Schedule a discovery callSchedule a discovery call
CASE STUDIES > OIL AND GAS
We created a computer vision tool that turns
Blowout Preventer pressure charts into clear
digital data. It cuts chart-reading time from
40 minutes to under 30 seconds, providing
engineers quick access to vital pressure info.
Understand how we helped Posidex automate and secure customer onboarding processes while maintaining stringent global regulatory standards.
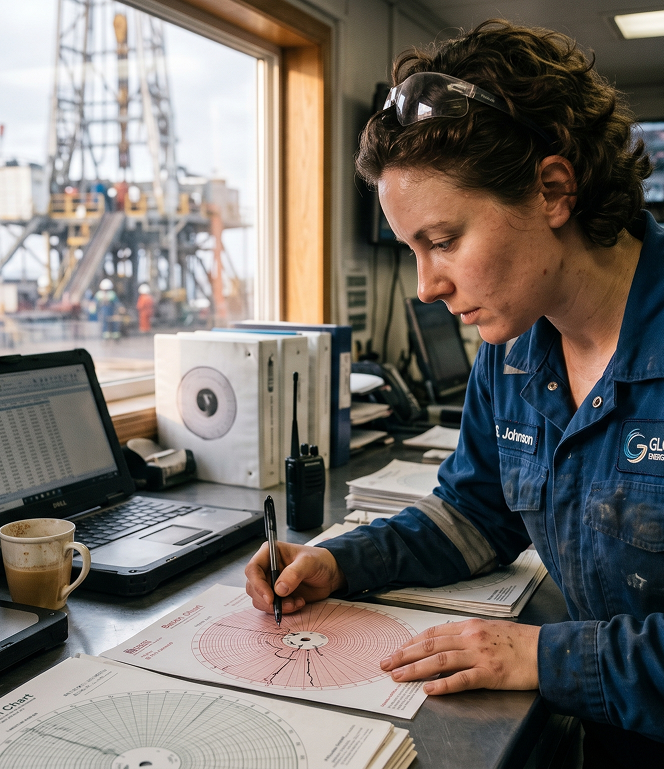
Monitoring BOP pressure is critical for rig safety, but legacy methods relied on circular paper charts. Transcribing readings by hand caused severe bottlenecks and introduced tracking inaccuracies.

40+ minutes spent manually interpreting pressure charts
High risk of human transcription errors
Slow access to operational insights
Aptagrim engineered a custom visual analytics solution that unwraps and extracts pressure curves from circular paper scans, converting them to structured database records in seconds.

Instant Digitization: Analysis loops completed in less than 30 seconds.
Algorithmic Consistency: Standardized trace translation removing human error.
API Database Integration: Encrypted JSON outputs ready for remote control room alerts.
//PROCESS
We worked with domain specialists to understand the BOP monitoring process, chart format, pressure parameters, and expected analytical outputs.
Faster analysis.
Quicker access to critical
pressure data.
reduction in analysis time
Chart interpretation loops dropped from 40 minutes per document to under 30 seconds.
Operational Insight
Engineers gained faster access to digitised pressure information for review and decision-making.
Manual effort
Automated chart interpretation cut down manual value extraction and helped teams work faster.
Aptagrim helps energy and industrial organisations build
AI-powered applications for visual analysis, monitoring,
data extraction, and operational decision support.